

How plant nursery Brabant Plant combines data from different sources with Agriware 365 Analytics
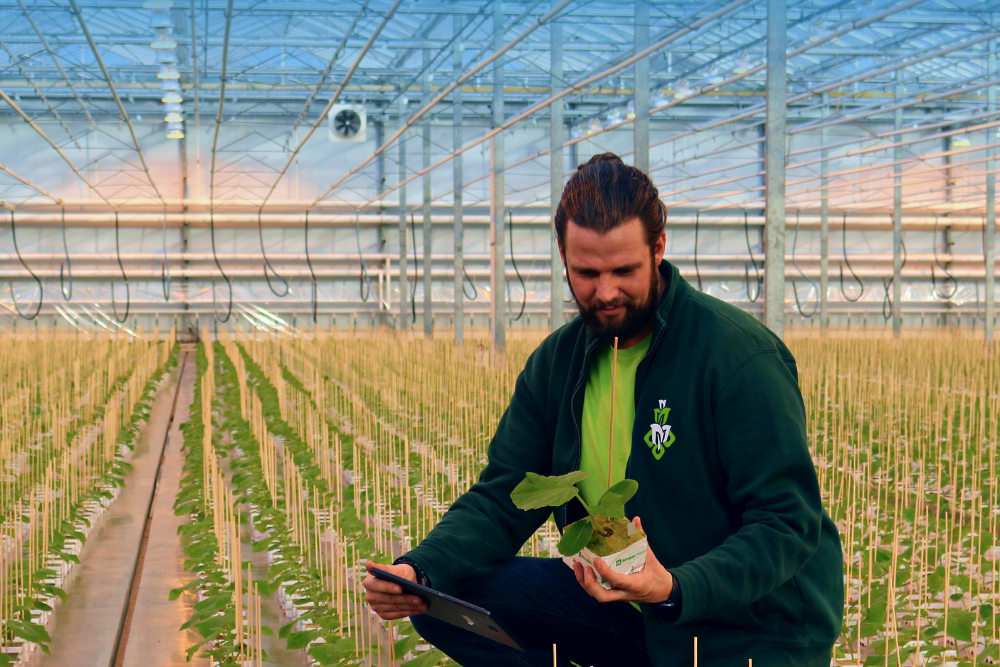
In Haarsteeg, North Brabant, Netherlands you can find plant nursery Brabant Plant. Brabant Plant is a customer of Mprise Agriware and recently the two companies started a new project, revolving around the question; how do you combine production data from Agriware Business Central with data from sensors and other data-sources? Here is where Agriware 365 Analytics came in. We spoke to Marvin Verkuijlen (crop researcher at Brabant Plant, shown in the photo above on the right) and Luuk van Geijtenbeek (manager Agriware Analytics).
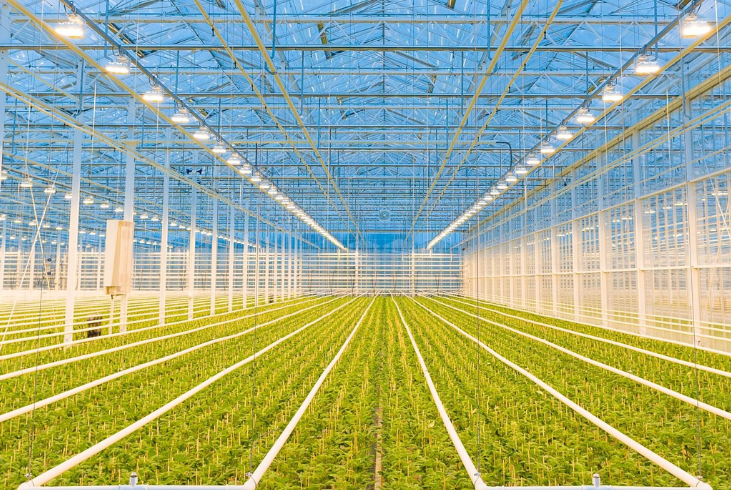
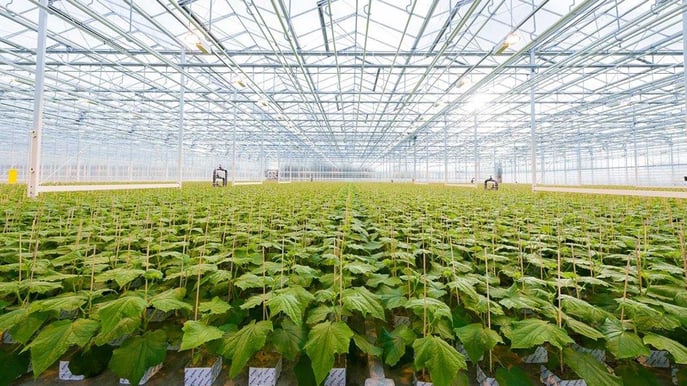
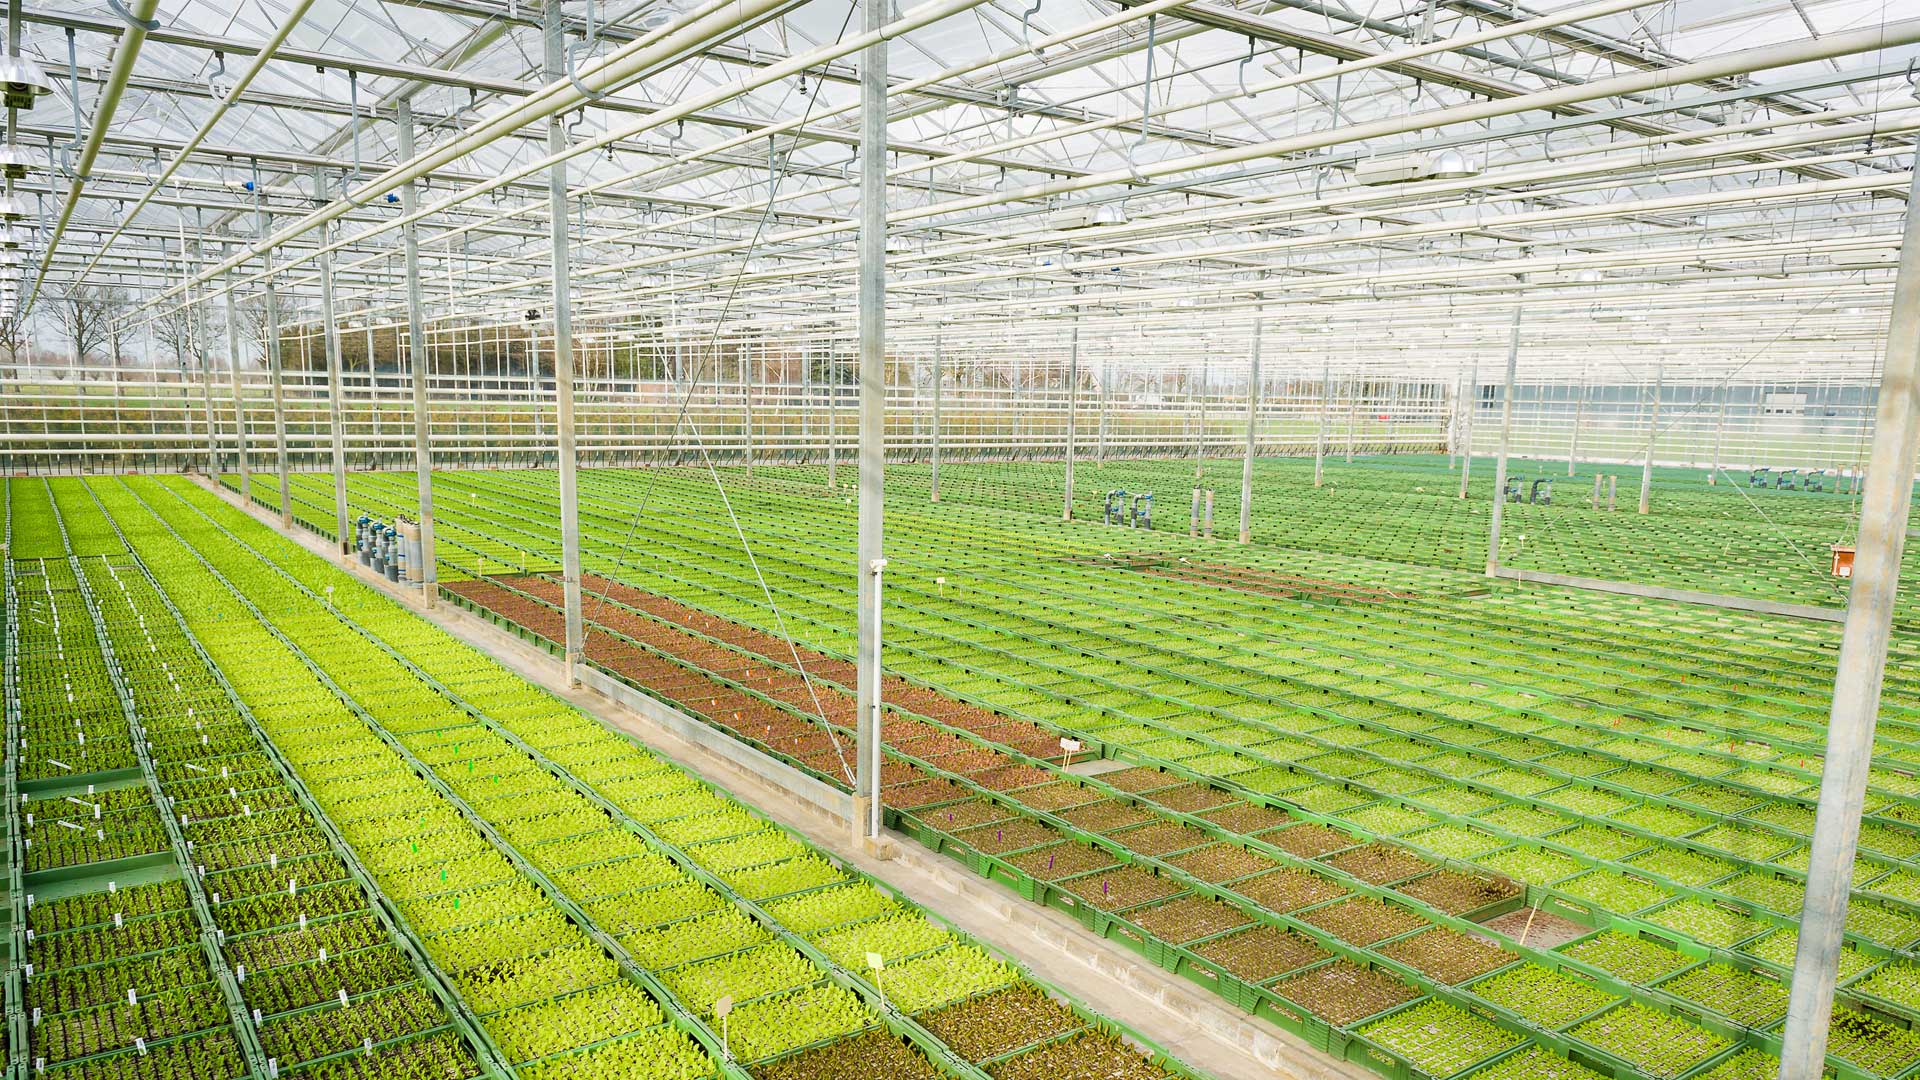
Marvin sits down after a bike ride inside the company. "I've just come from a thirty degree climate chamber and now I'm sitting in one of the offices for a while," he outlines the dynamics of his working day. The crop researcher at Brabant Plant studied applied biology with a specialization in applied plant research and talks passionately about his work: "We are a very diverse plant nursery. We do a lot with greenhouse vegetables such as tomatoes, cucumbers and peppers. We also have ornamental plants and propagation material. There are no less than 27 different departments, the processes are often complex."
Combining Business Central data and climate data from sensors
"There is a huge amount of data involved in managing and combining all the growing lots," Marvin explains. "All the greenhouses are controlled with climate data and each plant, species and phase has its own recipe. In addition, each plant is moved three or four times during the course of cultivation. Collecting all the data for each phase and each location is very time-consuming. Within Brabant Plant we have a dynamic team with a great deal of expertise. Our company strives to deliver the best possible quality on a customer-specific basis. Understanding the climate data is an important factor in this. For the most complete picture possible, a lot of data has always been collected. In addition to all climate parameters, this also included plant and variety-specific characteristics and all plant and crop assessments. I noticed that with the fragmentation of data systems, many insights remained unused."
"There is a tremendous amount of data involved in managing and combining all the growing batches"
Advanced data puzzles
When asked how the data collection worked before, Marvin answers: "To obtain a complete cultivation picture, lot information with date and location data from Agriware was manually merged with the climate data from the Priva climate system. This is quite a job per batch because the plant is rotated through different departments during its cultivation cycle. These data were then supplemented with other separate plant and crop measurements. Not only is that process prone to errors, it also takes a lot of time. I thought: we can do this differently. Then we joined hands with the team of Mprise Agriware, who with their IT expertise could give shape to the ideas. That is where this project originated and I think we can be very proud of what we have achieved together."
First phase successfully completed
Luuk van Geijtenbeek, manager Agriware Analytics, adds: "We started around the summer of 2021 and we are very pleased with the cooperation between our team and the team from Brabant Plant. In the first phase, we brought the lot and climate data together; the part of the work that first had to be gathered manually. Correct registration within Agriware Business Central is essential for this. Data must be complete and reliable. We are now entering a second phase of the project, in which we will combine the lot and climate data with assessment data from observations and inspections."
Second phase of the project
Marvin, enthusiastically: "Phase two will be really interesting! If we can link assessment data to batch and climate data, then we can really start to analyze. In this way, the grower's cultivation choices made in the greenhouse are recorded autonomously for each lot to create a so-called 'rotated recipe'. By also linking the 'outcome' from the plant's assessments, we can really start to build up business intelligence. It is a huge puzzle, but I think we have already put a lot of pieces together. I am quite proud of this and I am also happy that we could start working with Mprise Agriware on this."
"If we can link inspection data in addition to batch and climate data, then we can really start analyzing."
New Opportunities
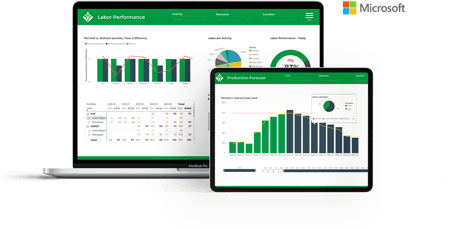
Marvin continues: "The amount of data is only getting bigger and bigger. With the data at batch level in order, the possibilities will soon be endless. You can make cost calculations, you can make a dashboard for each function within the company, we are currently looking at a combination with scouting data... I see a lot of possibilities. I would also like to include customer reviews, then you really have data across the entire chain."
"In addition to the cultivation data, we are in the process of mapping out the costs of labor, energy, transport and materials so that there is also an overview there, at the push of a button," Luuk van Geijtenbeek adds. "So the cost price post-calculation piece, where the actual costs, both direct and indirect, can be set against the pre-planned costs."
The amount of data is only going to get bigger and bigger. With the data in order at the batch level, the possibilities will soon be countless..png?width=400&name=Mprise%20Agriware%20png%20blog%20%20(1).png)
Step-by-step implementation
When I ask whether there has been much change in the way employees work, Marvin answers: "We have always been very busy with data-oriented work, but now we have tools that allow us to visualize the data much better. We have been able to take a huge step forward in the linked recording and visualization of data, so that the grower can steer on the basis of data even better. We want to be able to make the expertise and years of experience of our growers visual in the computer." How do you keep an overview during implementation? "Because the possibilities are countless, it's important for an organization to have a good sense of which functionalities have priority," Marvin explains. "One colleague of mine always says: pay attention to the difference between 'need to have' and 'nice to have'. I tried to frame it and approach the implementation step-by-step. In the end, the plan has been very well received and employees who can now click through data in an easy way are very excited."
Ready for the future with interconnecting data
Marvin summarizes the story: "Data-oriented work is the future, but for plant breeders, among others, it is a challenge to collect climate data per location, since parties rotate through multiple locations with their different planting phases. This makes data collection and analysis very cumbersome. Now that we have made this link, the 'rotated recipe' is recorded per lot. By now also linking the plant assessments we can gain more insight into what climate parameters do to the plant. In this way we can learn and optimize in an even more data-oriented way."
About Mprise Agriware | Quick Overview (2 mins)
Mprise Agriware delivers powerful, integrated software based on Microsoft Dynamics for the horticulture industry that ensures efficient and effective management & operation. Since 2004, we enjoy helping our customers to achieve improvements in planning, purchasing, sales, finance, inventory management and production. With Agriware 365 you get a grip on your entire greenhouse management and operations.
Mprise Agriware 365 | Leading in Hortibusiness Software