Titel
Get grip, drive growth
Get grip, drive growth
Measure and adjust your business performance
Based on the information requirements of a specific role, a dashboard is developed for analysing, monitoring and controlling processes.
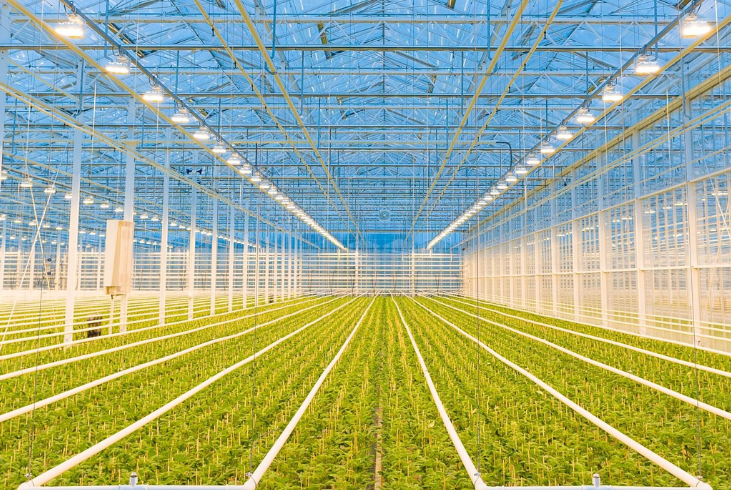
One place for all organisational data creates a full picture. Transform your data into information and gain a deeper understanding of it.
Gaining insight is one thing, acting upon it is another. The right interpretation of data can steer people and your systems directly. Actionable information.
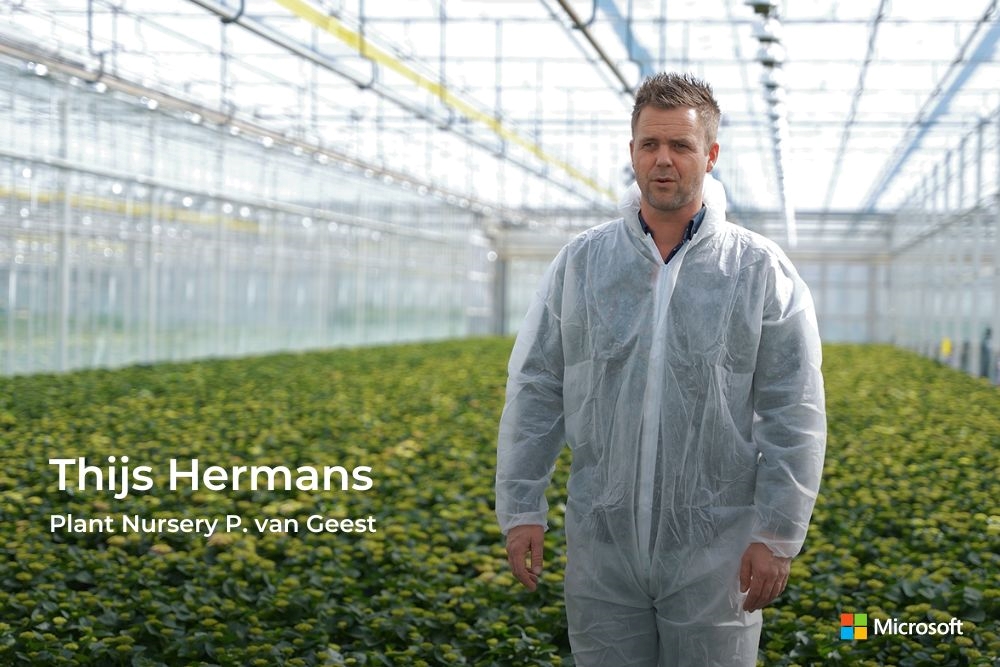
Every employee in the production cycle has different questions and challenges. That is why we put the user first in Agriware 365 Analytics. The platform is built from the various roles so that the user can navigate as accurately as possible.
-1.png?width=330&name=Untitled%20design%20(22)-1.png)
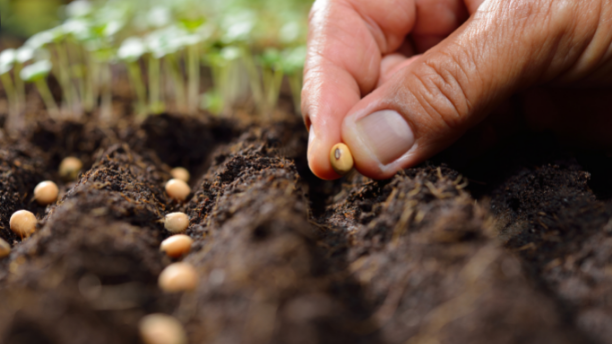
Record data for determining the best treatment for different crops, including climate. Link these data integrally.
-1.png?width=330&name=Untitled%20design%20(23)-1.png)
-1.png?width=330&name=Untitled%20design%20(21)-1.png)
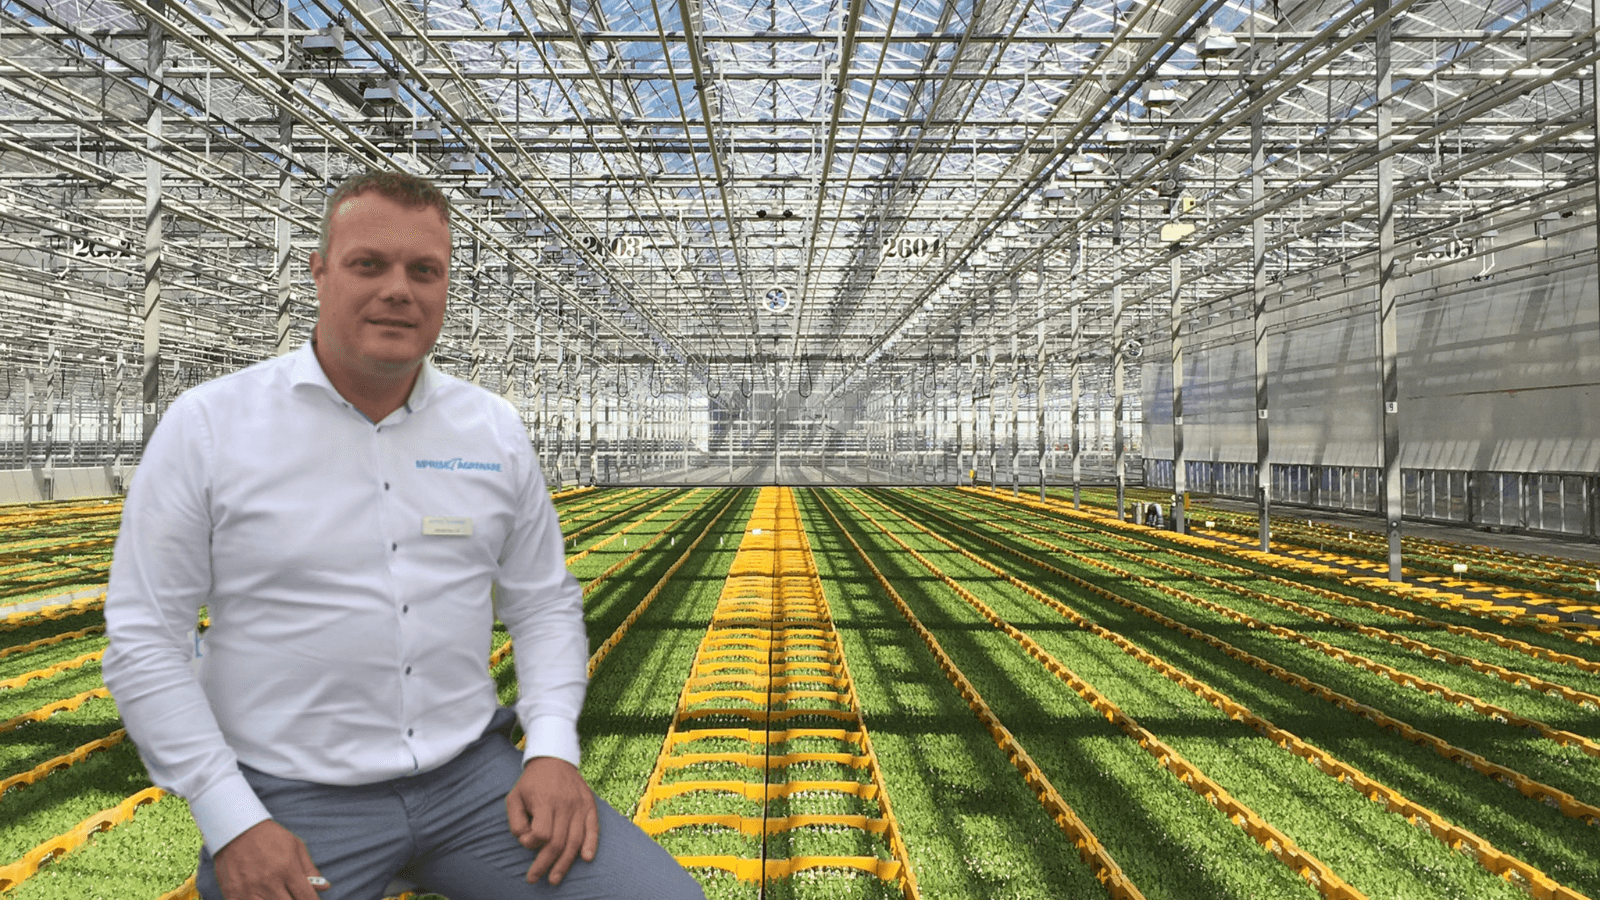
Agriware 365 Analytics offers customers the opportunity to convert data into action by means of future-proof software. We do this with ready-to-use dashboards that can be directly applied in your business process. Do you want a personal chat? Hit the button, ask your questions in the chat or call one of our experts.


/Vermeerdering/Mprise%20Agriware-%20Stekken-1-2.png)


